


Decoding Secret Chart Patterns for Algo Trading
A Comprehensive Guide
In the ever-evolving world of algorithmic trading, recognizing chart patterns container provide a significant advantage. These patterns, deeply rooted in the behavior of traders and market sentiment, can act as reliable predictors of future price movements. Let’s deep dive into the secret chart patterns that every algo trader should be aware of.

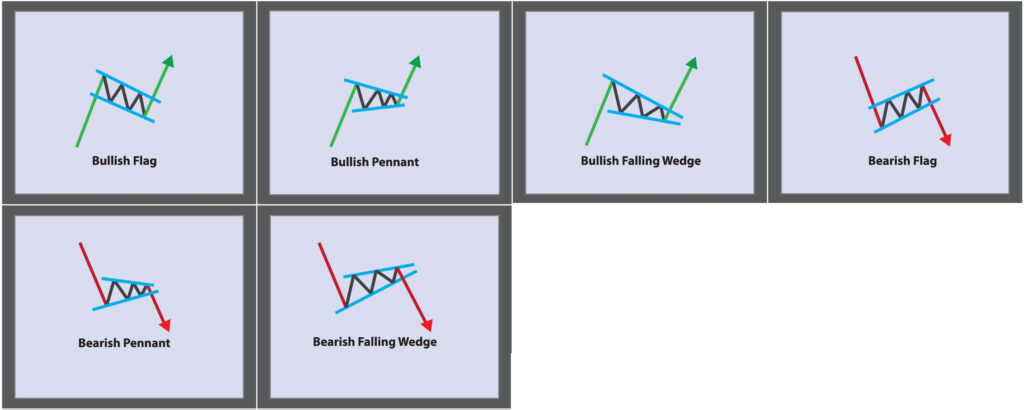
Continuation Chart Patterns
Continuation patterns suggest that the current market trend will continue after a brief pause or consolidation.
Bullish Flag & Bearish Flag: Resembling flags, these patterns are characterized by a sharp price movement (the pole) followed by a period of consolidation. They indicate a continuation of the prevailing trend, whether bullish or bearish.
Bullish Pennant & Bearish Pennant: These small symmetrical triangles that resemble pennants signify a brief consolidation before the previous trend resumes.
Bullish Falling Wedge & Bearish Rising Wedge: Falling wedges suggest bullish reversals, whereas rising wedges indicate bearish reversals. They’re identified by converging trendlines and decreasing volume.
Bearish Expanding Triangle: This pattern, with diverging trendlines, suggests that the market is gearing up for a continuation of the downward trend.
Example: Bullish Flag
In March 2020, many stocks experienced a rapid rise as markets rebounded from a sudden downturn. One such stock showed a sharp uptrend over two weeks, resembling the flagpole. Subsequently, it began trading in a tight, slightly downward sloping range, creating the flag. Traders who recognized this “Bullish Flag” pattern would expect the stock to break out upwards from this range, continuing its original bullish trend. And indeed, within a week, the stock price surged, rewarding those who acted on the bullish continuation signal.
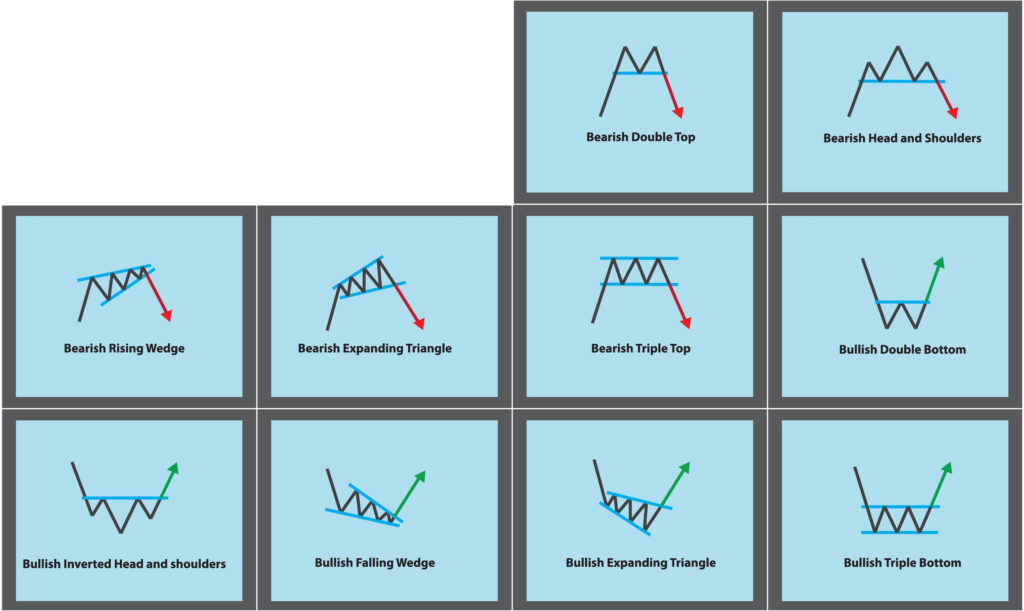
Reversal Chart Patterns
Reversal patterns hint that the current trend may soon reverse, changing the course of the price.
Bearish Double Top & Bullish Double Bottom: Double tops are M-shaped and indicate a bearish reversal after an uptrend. Conversely, double bottoms are W-shaped and signal a bullish reversal after a downtrend.
Bearish Head and Shoulders & Bullish Inverted Head and Shoulders: A head and shoulders pattern signals a trend reversal. The bullish version is an inversion of the bearish pattern.
Bullish Falling Wedge: Unlike its continuation counterpart, this falling wedge indicates a bullish reversal after a downtrend.
Bullish Expanding Triangle & Bullish Triple Bottom: These are both bullish reversal patterns, with the expanding triangle showing diverging trendlines and the triple bottom resembling three consecutive troughs.
Example: Bearish Head & Shoulders
Consider a scenario where a cryptocurrency, after a prolonged uptrend, forms a peak (left shoulder), followed by a higher peak (head), and then another lower peak (right shoulder). The base connecting the lows of these peaks is termed the “neckline.” If this cryptocurrency’s price falls and breaks below the neckline after forming the right shoulder, it’s a strong bearish reversal signal. Algo traders who detect this “Bearish Head and Shoulders” pattern might sell their positions or even consider shorting the cryptocurrency in anticipation of further declines.
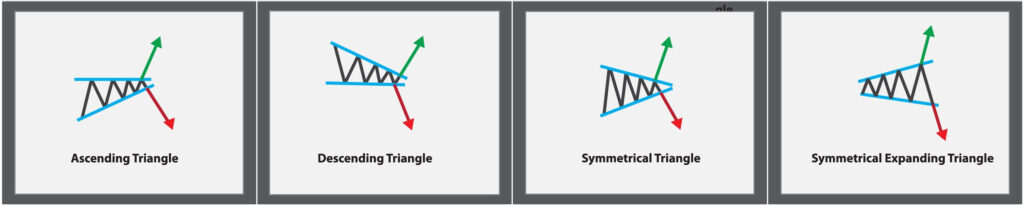
Bilateral Chart Patterns
Bilateral patterns can break in either direction, making them trickier to trade but also offering opportunities in both bullish and bearish scenarios.
Ascending Triangle & Descending Triangle: The ascending triangle has a horizontal top and ascending lower trendline, while the descending version has a horizontal bottom and descending upper trendline. Both can break in either direction.
Symmetrical Triangle: This pattern is formed by two converging trendlines and indicates a period of consolidation before a breakout.
Symmetrical Expanding Triangle: Distinguished by its diverging trendlines, this pattern suggests uncertainty in the market’s direction.
Example: Symmetrical Triangle
Imagine a tech company’s shares experiencing higher lows and lower highs over several months, causing the price to consolidate within two converging trendlines, forming a symmetrical triangle. This pattern doesn’t provide a clear direction of the breakout. However, the breakout’s direction, once it occurs, provides a strong market signal. If the stock price breaks above the upper trendline, it’s a bullish signal, prompting traders to buy. Conversely, if it breaks below the lower trendline, it’s a bearish signal, indicating a selling opportunity.
Understanding these chart patterns and their implications is crucial for algo traders. Integrating them into your trading algorithms can enhance prediction accuracy and potentially boost profitability. Remember, while these patterns provide insights, it’s essential to consider other market factors and indicators for a holistic trading strategy.
Happy Trading!